275 NPR's own graph (unintentionally) shows TRUMP WON! LOL! These people are stupid! (media.greatawakening.win) posted 3 years ago by GODisinc0ntr0l 3 years ago by GODisinc0ntr0l +277 / -2 25 comments download share 25 comments share download save hide report block hide replies
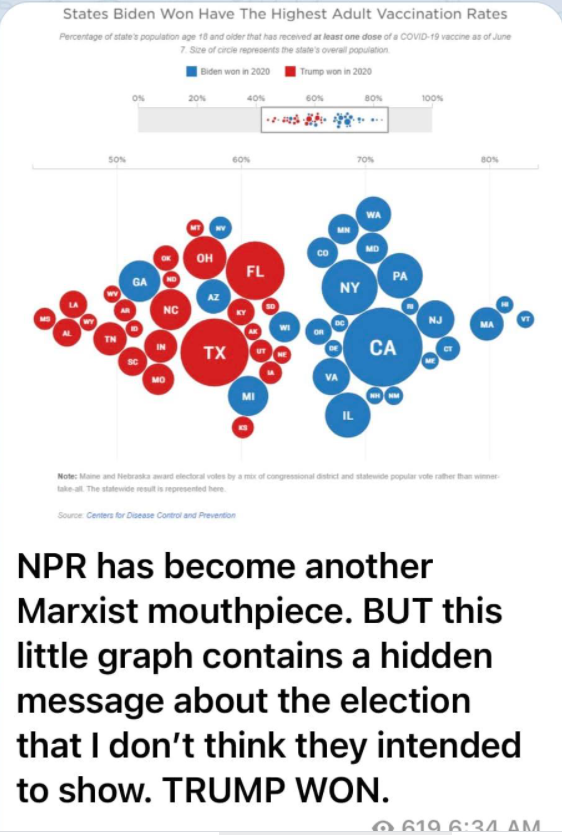
No the color is who won the state. The location (left to right) is the % of people who got jabbed, see just above the circles for percentages.
This graph doesn't show trump won the election. It shows trump and Biden states and how they voted affects the % of jabbed people.
I think the point is the four blue states on Trump’s side are the four swing states that cheated in the election. With the exception of Pennsylvania.
So PA doesn't count because it doesn't fit the data? Isn't that what we bitch about regarding covid? Look, trump won, we all know it but let's not reach. They aren't saying what the OP claims. That's all I'm saying. Peace.