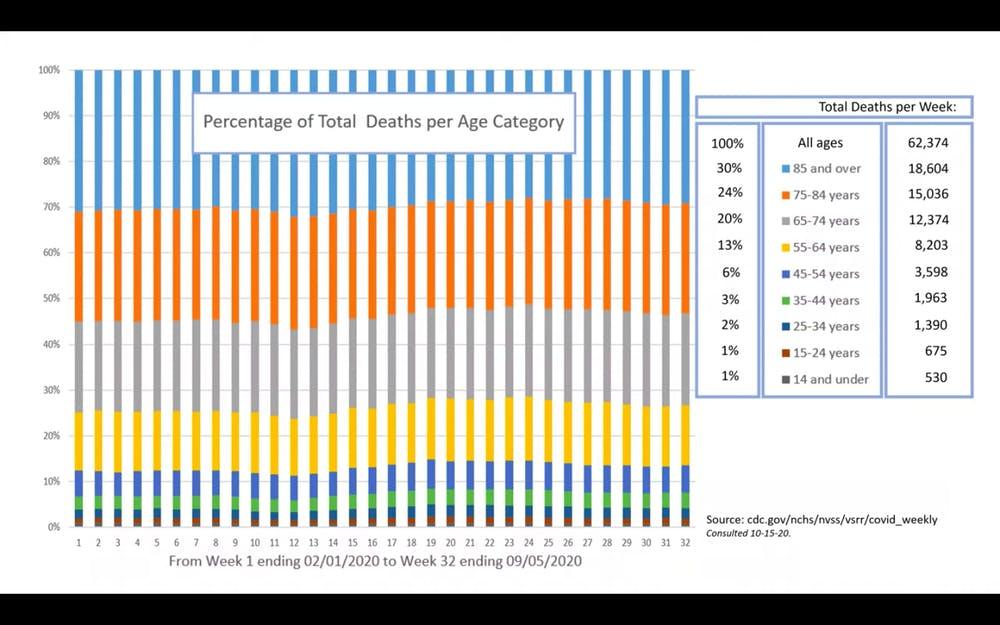
I did a search on the woman who did this study. Lots of msm hits on it being 'fact checked' as flawed and misleading. John Hopkins even removed the piece because it was being used by conspiracy theorists on social media to present inaccurate information. They don't offer a scientific rebuttal or define what & how info is misleading.
Here is the editorial from the newsletter addressing the retraction. (the first few comments are gold...and then comes the loud mouth liberal idiot to ruin any intelligent discourse.)
This is one of the trends I am seeing. They fact checks and force a retraction with vague reasoning with no evidence to prove the study was flawed. The data was collected via the CDC databases, so many flaws in the data would be from the source. Her calculations seemed accurate to me, but i did a cursory check. When nothing jumped out as unreasonable or Common Core math, I assumed that a researcher from John's Hopkins would be pier reviewed and verified. I truly believe that she did her research diligently and in good faith. The factcheckers have an agenda which makes them suspect to me
It's the same flu we get every year. This time there is BIG money to be had if you say Covid, Covid, Covid. Do that and if your in govt, the news or in health services, you get paid handsomely.
One would need similar graphs from similar time frames over the last several years to really see if there is a difference. Not that I think there is one.
There are several out there, but they were "debunked" because of the 2020 data was not all verified yet. The rest of the data was verified true. I'll see if I have it saved
Fun with mathematics. Some ammunition to keep in your back pocket.
.....
US Total deaths by year per CDC:
2013: 2,596,993 2014: 2,626,418 2015: 2,712,630 2016: 2,744,248 2017: 2,813,503 2018: 2,839,205 2019: 2,855,000 2020: 2,512,880 Through 11/14 (318 days)
Per day,
2013: 7115 2014: 7195 + 80 2015: 7431 + 236 2016: 7518 + 87 2017: 7708 + 190 2018: 7778 + 70 2019: 7821 + 43 2020: 7902 + 81
Interesting progression.
Average annual increase in deaths per day.
7902 - 7115 = 787 / 7 = 112
2019 » 2020 = 81
See, we can do numbers too.
~{°¡°}~
I did a search on the woman who did this study. Lots of msm hits on it being 'fact checked' as flawed and misleading. John Hopkins even removed the piece because it was being used by conspiracy theorists on social media to present inaccurate information. They don't offer a scientific rebuttal or define what & how info is misleading.
Here is the editorial from the newsletter addressing the retraction. (the first few comments are gold...and then comes the loud mouth liberal idiot to ruin any intelligent discourse.)
https://www.jhunewsletter.com/article/2020/12/on-the-retraction-of-a-closer-look-at-u-s-deaths-and-our-coverage-of-covid-19
This is one of the trends I am seeing. They fact checks and force a retraction with vague reasoning with no evidence to prove the study was flawed. The data was collected via the CDC databases, so many flaws in the data would be from the source. Her calculations seemed accurate to me, but i did a cursory check. When nothing jumped out as unreasonable or Common Core math, I assumed that a researcher from John's Hopkins would be pier reviewed and verified. I truly believe that she did her research diligently and in good faith. The factcheckers have an agenda which makes them suspect to me
It's the same flu we get every year. This time there is BIG money to be had if you say Covid, Covid, Covid. Do that and if your in govt, the news or in health services, you get paid handsomely.
https://web.archive.org/web/20201126043553/https://www.jhunewsletter.com/article/2020/11/a-closer-look-at-u-s-deaths-due-to-covid-19
One would need similar graphs from similar time frames over the last several years to really see if there is a difference. Not that I think there is one.
There are several out there, but they were "debunked" because of the 2020 data was not all verified yet. The rest of the data was verified true. I'll see if I have it saved