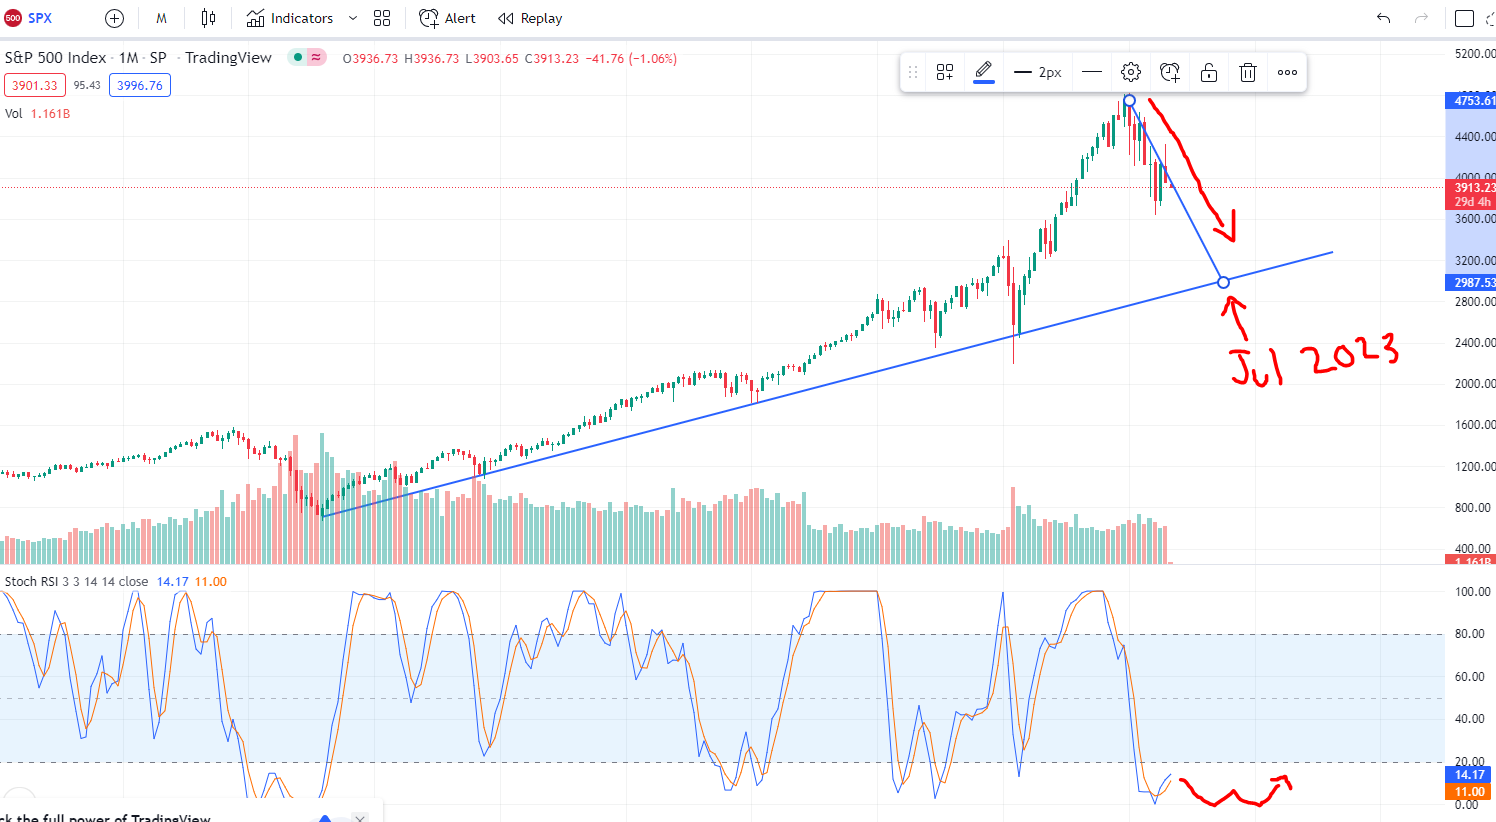
A solid "floor" has been formed over the past couple of years that indicates that there is a bottom as you can see, the long blue line at a 30 degree angle.. that's the "floor"... when it hits the floor it bounces back up.
There is a solid line forming at the peak, to the floor.
The volume has drastically gone down, see the red and green bars below the chart.
Stoch RSI is rock bottom on the monthly chart and I expect it to stay there until it hits the floor.
Pretend that some of us don't know what that chart is telling us.
Now... what is that chart telling us?
4 indicators:
A solid "floor" has been formed over the past couple of years that indicates that there is a bottom as you can see, the long blue line at a 30 degree angle.. that's the "floor"... when it hits the floor it bounces back up.
There is a solid line forming at the peak, to the floor.
The volume has drastically gone down, see the red and green bars below the chart.
Stoch RSI is rock bottom on the monthly chart and I expect it to stay there until it hits the floor.