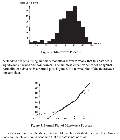
It means that there is a period of much activity at the start and then a lull. Then it gears up and BOOM, they all start popping at once. That eventually tapers off again.
It isn't a standard climax. There are actually two peaks.
Why that matters?
I think this is the projection for arrests and activity. I think Q and Trump's use of "Popcorn" refers to the distribution graph made by the popping frequency of popcorn.
If we count the first 4 intervals on the top graph as Trump's time after the "Calm before the storm" statement, I'd say the Biden Administration's year up until now is the lull at 75 seconds.
Which means we only have just begun.
This process is only 5/17ths the way through, according to the top distribution graph.
Extrapolating it out, where October 5th, 2017 is the start on the graph (the first two intervals in 25s are missing, which I'm counting as Trump's Start date, Jan 20th, 2017) and Biden's term start date being Jan 20th, 2021:
Each interval is 243.5 days.
The second peak at 175 seconds is in 3652 days from start (Jan 20th, 2017)
With the calm before the storm being at 25 seconds.
Which means the second peak is slated to occur on January 20th, 2027.
From actual start, it would mean we are looking at September 21st, 2023 until we reach 125 seconds.
Not happy with this assessment, but I'm making a TON of presumptions.
The scale might be different than I'm interpreting, so way too much user error to say for certain.
What does this mean?
It means that there is a period of much activity at the start and then a lull. Then it gears up and BOOM, they all start popping at once. That eventually tapers off again.
It isn't a standard climax. There are actually two peaks.
Why that matters?
I think this is the projection for arrests and activity. I think Q and Trump's use of "Popcorn" refers to the distribution graph made by the popping frequency of popcorn.
If we count the first 4 intervals on the top graph as Trump's time after the "Calm before the storm" statement, I'd say the Biden Administration's year up until now is the lull at 75 seconds.
Which means we only have just begun.
This process is only 5/17ths the way through, according to the top distribution graph.
Extrapolating it out, where October 5th, 2017 is the start on the graph (the first two intervals in 25s are missing, which I'm counting as Trump's Start date, Jan 20th, 2017) and Biden's term start date being Jan 20th, 2021:
Each interval is 243.5 days.
The second peak at 175 seconds is in 3652 days from start (Jan 20th, 2017)
With the calm before the storm being at 25 seconds.
Which means the second peak is slated to occur on January 20th, 2027.
From actual start, it would mean we are looking at September 21st, 2023 until we reach 125 seconds.
Not happy with this assessment, but I'm making a TON of presumptions.
The scale might be different than I'm interpreting, so way too much user error to say for certain.
This premise needs to be peer reviewed.
X22 Dave told me so.