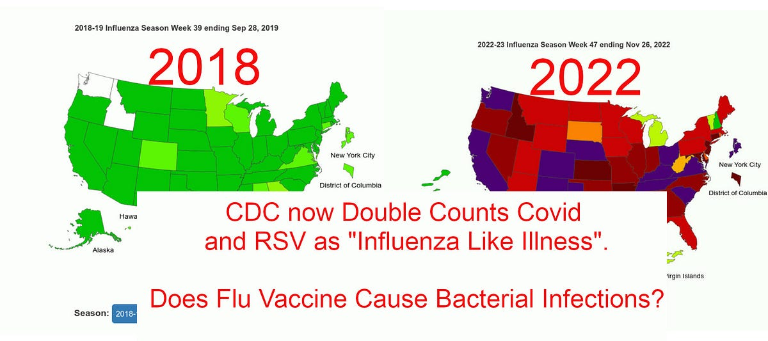
The graph on the left looks like a full year starting Sep-2018 and ending Sep-2019 and the graph on the left start Nov-2022 and ends in Nov-2023 (so still in progress and already color coded to be higher cases).
But I get what you're saying because the map doesn't show what the colors case ranges are which is a problem. So I guess the only sensible thing to do is look at the other pictures and sources.
It says week 39, implying that it is from Jan to September, not September to September
Week 39 of the year is sometime around the 9th month of the year, hence September. I think that is what is meant by week 39