Polling has become a complicated subject to explain thanks to technology. Gone are the days of "everyone has a landline and an equal chance of being selected" to survey designs that include landline, mobile, and online. This poll included all 3 modes and so probability sampling and margin of error goes out the window. Especially is the case for opt-in online polling, which this survey included. I'm not going to get techy into margin of error estimates vs. credibility intervals (frequentist vs. Bayesian) - but in survey design a researcher can hide biases in the selection of opt-in participants. I find it interesting though, when looking at the published results/ data that the "Mode" of the participant isn't reported on. You can see results by demographics (age, gender, race) but not by survey mode. And for every state, the rate of opt-in/ online participation ranged from 32.4 - 47.9 or upwards of 1/3 of the 1000 participants per state. For me, any poll that doesnt provide full transparency across subjects, and modes is to be taken lightly.
If you download the full results and look at the ('state' XT tabs) you get a cross-ref. Here's a head scratching example, or two:
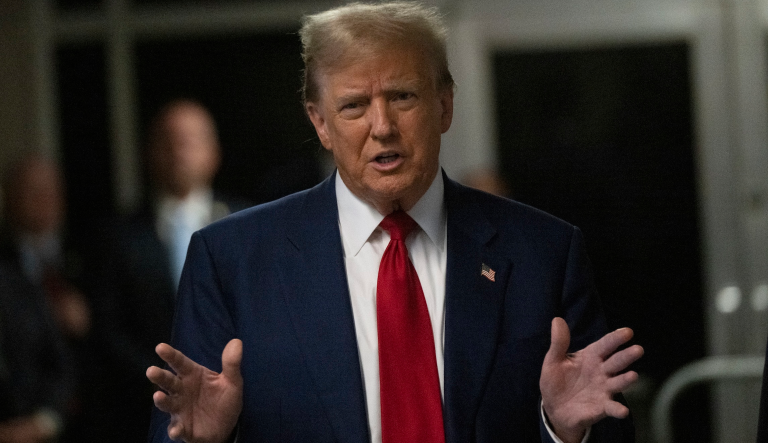
In AZ, there are 39 respondents who believe the Trump NY Trial is Witch-hunt but are voting for Ruben Gallago (D) for Senate race in a hypothetical scenario.
In GA, 29 people thought the same NY trial was also seen as a witch-hunt but said they would (hypothetically) vote for Biden in a 2024 match-up against Trump.
Sure!
Man, I'd like to meet these people in person.... to put a face to idiocy.
Polling has become a complicated subject to explain thanks to technology. Gone are the days of "everyone has a landline and an equal chance of being selected" to survey designs that include landline, mobile, and online. This poll included all 3 modes and so probability sampling and margin of error goes out the window. Especially is the case for opt-in online polling, which this survey included. I'm not going to get techy into margin of error estimates vs. credibility intervals (frequentist vs. Bayesian) - but in survey design a researcher can hide biases in the selection of opt-in participants. I find it interesting though, when looking at the published results/ data that the "Mode" of the participant isn't reported on. You can see results by demographics (age, gender, race) but not by survey mode. And for every state, the rate of opt-in/ online participation ranged from 32.4 - 47.9 or upwards of 1/3 of the 1000 participants per state. For me, any poll that doesnt provide full transparency across subjects, and modes is to be taken lightly.
If you download the full results and look at the ('state' XT tabs) you get a cross-ref. Here's a head scratching example, or two:
In AZ, there are 39 respondents who believe the Trump NY Trial is Witch-hunt but are voting for Ruben Gallago (D) for Senate race in a hypothetical scenario.
In GA, 29 people thought the same NY trial was also seen as a witch-hunt but said they would (hypothetically) vote for Biden in a 2024 match-up against Trump.
Sure!
Man, I'd like to meet these people in person.... to put a face to idiocy.