Good post and I'll add this again like I first started saying it when I discovered it nearly three years ago.
On the UK government's website you can find all sorts of published Health data, free to all to view and download.
One such report is the weekly 'NOIDS' - statutory Notification Of Infectious Diseases.
This is based on completed returns of the applicable diseases as diagnosed by an actual clinician.
By the middle of 2020, the C19 numbers were often already barely in the three figures - there available to read in black and white, week after week.
So, where did the daily 'thousands of cases' numbers, and deaths, that the media and politicians were incessantly blaring out actually get counted from?
A good read that describes how the numbers were cooked up to support a crooked narrative.
Vast majority of those vaccinated were not “fully vaccinated”
At the time the text was sent out, “fully vaccinated” in the UK was defined as: “at least 14 days since 3rd jab” or “between at least 14 days and less than 6 months of 2nd jab”. So, the official figure of 8 out of 10 “not fully vaccinated” might have been right but was totally misleading since almost ALL of those who were vaccinated (i.e., had at least one jab) at that time were “not fully vaccinated”.
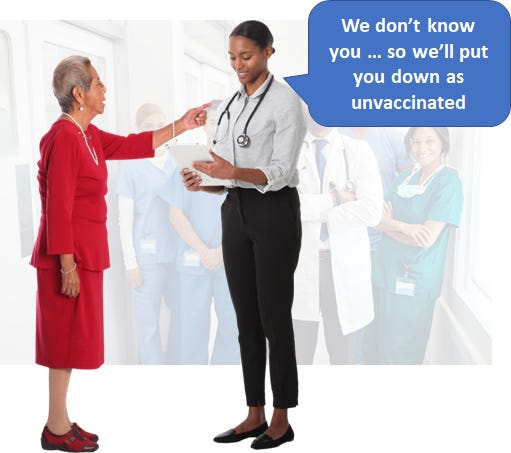
This creates a false semantic equivalence between ‘unvaccinated’ and ‘not fully vaccinated’.
Many media sources, including the BBC, pushed the 80% unvaccinated claim without even mentioning the ‘fully vaccinated’ criteria:
And intentionally fraudulent estimates on the percentage of the population of who were vaccinated. If for example, you have 50%/50% vaxxed/unvaxxed in the population and you claim that it's 90%/10% vaxxed/unvaxxed, then if you have 50%/50% vaxxed/unvaxxed showing up in hospitals, you can claim that the 10% unvaxxed in the population make up 50% of the hospitalized. Except it all stems from you fraudulent estimation of the population's vaxx rate. They played this same game in Canada to claim the unvaxxed caused too many car crashes. More was wrong with that so-called study as well, but that was the main thing.

Good post and I'll add this again like I first started saying it when I discovered it nearly three years ago.
On the UK government's website you can find all sorts of published Health data, free to all to view and download.
One such report is the weekly 'NOIDS' - statutory Notification Of Infectious Diseases.
This is based on completed returns of the applicable diseases as diagnosed by an actual clinician.
By the middle of 2020, the C19 numbers were often already barely in the three figures - there available to read in black and white, week after week.
So, where did the daily 'thousands of cases' numbers, and deaths, that the media and politicians were incessantly blaring out actually get counted from?
🙄
A good read that describes how the numbers were cooked up to support a crooked narrative.
And intentionally fraudulent estimates on the percentage of the population of who were vaccinated. If for example, you have 50%/50% vaxxed/unvaxxed in the population and you claim that it's 90%/10% vaxxed/unvaxxed, then if you have 50%/50% vaxxed/unvaxxed showing up in hospitals, you can claim that the 10% unvaxxed in the population make up 50% of the hospitalized. Except it all stems from you fraudulent estimation of the population's vaxx rate. They played this same game in Canada to claim the unvaxxed caused too many car crashes. More was wrong with that so-called study as well, but that was the main thing.
Not murky, but cherry picked stats. How to lie with statistics. Bill Gates was seen with a copy of the book.
They all knew what they were doing.