Why do you think there's some time component for the vote additions? It's just a discrete datapoint with a timestamp: at this point in time, the vote total changed to x. Any slope you see in the line is a result of how it was rendered, and it will be present in spikes of both republican and democratic votes.

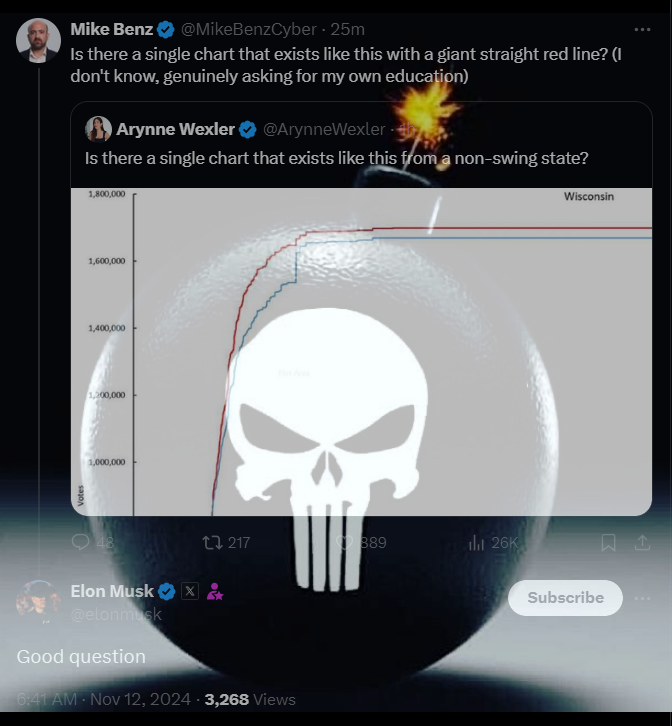
Yeah, if you want to nitpick graph rendering minutia then we can see the blue line isn't perfectly vertical either: https://i.imgur.com/0Q4PbHO.png
Yes, we can. You still haven’t pointed out where on the graph a red line is vertical. Give me an x-axis reference.
Why do you think there's some time component for the vote additions? It's just a discrete datapoint with a timestamp: at this point in time, the vote total changed to x. Any slope you see in the line is a result of how it was rendered, and it will be present in spikes of both republican and democratic votes.