In addition, there is a category now shown in these pie chart. People whose vaccination status is unknown. If you wanted to manipulate the date, you could chose to shift some cases into that category.
According to their numbers, there should be 423 people in ICU who have tested positive for COVID (per https://covid-19.ontario.ca/data/hospitalizations). The above ICU chart only adds up to 278. It looks like they have 145 patients for which they do not list a vaccination status. In addition, they used to have a disclaimer for the above numbers about them only showing the patients whose vaccination status is known. They have since removed that disclaimer for some reason.
Here is the website where the above came from from reference:
If you scroll down to just the regular "COVID-19 cases by vaccination status" you will notice 2 things:
If you click on the "Table" view for the graph below "COVID-19 cases by vaccination status" (the default view is "Graph") they list out "Vaccination status unknown Cases". So they do show these for the non hospitalized cases but don't bother to show them for the hospital cases.
If you look at the number of cases per 100,000k people (this is a population adjusted number), more vaccinated people are testing positive on a per 100,000k basis than unvaccinated or even partially vaccinated. Note that the same government that releases these numbers claims the vaccine is the solution to this virus even as their own numbers contradict them.
I will finish off by saying that I have been following this data for the last few months and at times it does behave in a weird way. For example, in late November, the share of fully vaccinated patients in both graphs seemed to be unnaturally adjusted over a period of 3 days. I base this on:
On the last day of this period, the reduction in fully vaccinated patients was exceptionally high in the "In Hospital but not the ICU" graph. Almost twice as high as the number of patients typically added or removed. And it was not coming off a weekend where some hospitals don't report new numbers and then report them all at once (it was November 24th to 25th).
It reversed the trend that was true for at least the last 2 months, where the fully vaccinated group kept gaining share of all the patients. Not every day due to natural variability, but in the long term. There was never a 3 day period where this trend was broken and so significantly.
After this perceived adjustment, the trend resumed (the share of fully vaccinated patients continued to increase again when compared to all the other groups).
Over that period, both the hospital and ICU graphs trended in the same direction at all times. You would expect this if the numbers were both being manipulated together. In itself, this is not proof of anything as both these categories are related so do typically change in the same direction on any given day. However, days where they change in opposite directions are not uncommon and for both of them go opposite to a well established trend for 3 days straight is suspicious.
What I’ve seen is they try to claim the control breaks down like
Unvaccinated are ~%10 of pop
Vaccinated are ~%90 of pop
They gaslight them in an attempt to try and skew / lessen the reality of the numbers by implying there are far more serious illnesses in the unvaccinated - which every single report contradicts. It really is %90 gaslighting and lies they know will be bolstered by the %10 of Confirmation Bias in the normies
Meanwhile they are slowly sorting out that while they feel sicker and sicker and more tired - their friends that are unvaxxed don’t feel shit for the most part.
According to this data, a larger proportion of the vaxx-free population is hospitalized than the vaxxed.
The problem is that incidental cases - cases where someone was hospitalized for a non-C19 reason - are included in the stats.
As I understand it, if a vaxxed person goes into the hospital for something like appendicitis, they will not be screened for C19 as part of the process because they are vaxxed. However, if a vaxx-free person is admitted for appendicitis, they are screened for C19, and if they test positive, then they are considered a vaxx-free C19 hospitalization even if they have no symptoms.
Thx for posting this info, I wasnt gonna bother to look at the actual website because of all the uncertainties that are usually in the released data. To me, the screenshot suggests that the vax does indeed reduce hospitalization.
The vax rate is 77-80% in Ontario, they only make up 55% of icu beds.
They do, however account for ~76% of non-ICU hospital admissions.
Based on this data alone, one could come to the conclusion that the vax does prevent severe disease.
BUT WE MUST ASK OURSELVES, HOW MUCH DO YOU REALLY TRUST ANY DATA COMING FROM THESE PEOPLE...
Not a shill, just a guy who looks at information objectively.
It also seems deceptive that they have the largest portion of the circle a lighter colour than the smaller portions, I think it should be the other way around.
Hmm not sure I agree with that assessment. If 80% of the population gets vax, and the same percentage of vaxxed/unvaxxed get sick, then it will look like 4x more risk for vax population. Based on this graphic, something like 3x more hospitalizations were vaxxed and maybe 1.2x ICU were vaxxed...but Canada has four times as many vaxxed people as unvaxxed. Bottom line then is that unvaxxed are more likely to be hospitalized and much more likely to go to ICU.
If you click the context button and scroll down to the "COVID-19 cases by vaccination status" section, you will see that on about 12/23 the vaccinated surpassed the unvaccinated as a rate per 1000.
That shows case rate, not hospitalization or ICU rate. That is not relevant unless we can also see how many of each group never got tested. Most stats I have seen show that vaxxed get tested at a much higher rate (probably because they fear the virus more).
youre right and it's too bad people are accusing you of mental gymnastics. i had to take a lot of statistics courses for my work and your math is accurate.
I don't necessarily believe the data that's being released and I think hospitals are killing patients BUT, your interpretation of this graph being presented IS accurate!
The ICU counts are almost even between vaxxed and and unvaxxed when there are 4x more vaxxed. Not sure I follow your logic but that clearly shows unvaxxed go to ICU at a much higher rate.
You are correct. It is a statistical error to compare rates for the vaccinated and unvaccinated based on the general population total. If we lived in a perfect world, I’d want to see propensity score matching for patients and vaccination totals that weren’t “potentially incredibly overestimated” like Bloomberg admitted last month.
The biggest issue is that we cannot trust any of the data being presented. The definition of vaccinated is constantly changing, people are being included in counts when they aren’t even admitted for COVID, and there’s financial incentive to record “COVID cases” and “COVID deaths” that throw all data collection and analysis into question.
Until such time we can establish data integrity, comparing these rates is basically worthless.
Basically saying that vaxxed pretty much should be none in the ratio if it actually worked. Like if we're talking measles vax or a vax that actually works, if you have a 4:1 ratio of vaxxed to not vaxxed you wouldn't see a similar ratio of the vaxxed to unvaxed catching measles, it would be more like 1 vaxxed catching measles to 4 million unvaxed catching measles
If 75% are covid vaxxed and in the hospital/Icu, to 25% not, and a similar ratio are hospitalized/ in icu it means it really doesn't friggin work at all and there's another agenda behind the vaxxxxxx
What doesn't make sense? In a population of 100, say 80 are vaxxed. Say also that 40 vaxxed go to ICU and 10 unvaxxed go to ICU...50% of each. You can't say vaxxed are 4x more likely because the relative rate is the same (and in this data unvaxxed are clearly not going to ICU at the same rate).
no sorry but it's how rates work. you can't compare raw # of people in the ICU. you have to compare % of vaccinated population that's in ICU to % of unvaccinated population that's in ICU. I do this stuff as my career (not medical, but similar statistical analysis) and comlib is correct.
Yes you can. That's quite literally what sample sizes are. Although those are subject to having their own limitations as well (sampling bias for example). And one would have to then look for statistical significance or effect size to measure reliability and validity.
But to claim the findings mean "nothing at all", well that's just your opinion.
Maybe unvaxed more likely to be sent to ICU because not getting any treatments like Ivermectin. Thats only for the vaxed! So many variables, they are spinning the numbers so many ways.
I've been tracking this site for a number of weeks (https://covid-19.ontario.ca/data) and every day it keeps skewing further toward vaccinated being the one's hospitalized and in ICUs.
The same site also shows that (adjusted for population size) the vaccinated test positive at higher rates.
I truly didn't want the ADE stuff to come true but this seems like evidence that it is.
If you watch the Dr. Malone interview on Joe Rogan, you kind of get the hint that the vaccine is ill fitting - and may be harming immune system response.
IIRC, the Netherlands also reported that the vaccine is associated with negative efficacy over unvaccinated efficacy.
Got it, now do the total vaccinated, any number of shots, and percentage who got heart problems, blood clotting, strokes and other adverse events and then let's do a side-by-side with the same events in the unvaxxed. I'll check back
This is the frustrating part. If it was a binary, "do they have the shot, yes, or no", it would be a lot easier to interpret the data. But these are probably gender study doctors, so they don't believe in binary data, it needs to be fluid to express itself.
Let's put it this way: If someone is not vaccinated, it would not shock anyone if they "got it". If someone is vaccinated, it is shocking that they become infected, as the vaccine obviously failed them. That is all we need to know. Failed, failed, failed.
If you were on the actual website, you could hover over the little ? marks and get explanations of the terms. "Unvaccinated" could mean they've had one dose but 14 days haven't passed yet.
Which is the exact Sweet Spot during which many of “the unvaxxed” need to get rushed to the ER with life-threatening jab effects, or die.
There’s the old saw about “lies, damned lies, and statistics” for a reason. It’s exactly how liars in authority operate. Does anyone think a medical bureaucracy that has absolutely gone off the rails is anything resembling an honest broker here?
Nope. My eyes are opening up and seeing the whole industry in an ugly light. My health card expired about 20 years ago and I have no plans to renew it.
Ontarians aged 12 or older in 2021 fully vaccinated - 88.4 %.
Vaccinated people there are much bigger group so vaccine "works" based on this dataset.
The thing is you get these "good" numbers temporarily and only in covid-19 statistics. Due to higher inflammation (I think this will become main problem) from vaccines your healt will deteriorate faster in the future. Autoimmune diases, cancers etc... And I don´t even mention serious adverse reaction from vaccines at the moment..
88% are fully vaccinated and yet are nearly 75% of the hospitalizations. That is not a significant difference, and certainly not worth turning your immune system into a pfizer subscription service over.
The propaganda is often stated that the unvaccinated are driving the pandemic. Clearly not true, per the above.
It is also being stated that our hospitals are full of the unvaccinated so when grandpa has a stroke, he cannot get into the hospital. Again, clearly not true.
Oh, I see now. Canadians still believe pandemic of unvaccinated narative. With almost 90 % of vaccinated people? Pretty crazy. We were around 60 % and a lot of people saw through it and won´t get booster now. Still not so great either.
88% are vaxxed but vaxxed only make up half of ICU. That is definitely a significant difference (4-6x more risk for unvaxxed) that can't be easily explained away.
I have to step in and play my least favorite character, "Devil's Advocate" :) To be a true comparison, pie charts need to show the percent of each group from the general population. Since there are presumably far more "vaccinated" in Canada, than "un-vaccinated", the percentage of "un-vaccinated" people would likely be much higher than the percentage of "vaccinated" people. (but I won't be getting the clot shot even if there are 1000x more people, as a percentage of their total, who are "un-vaccinated" in the hospital than "vaccinated".
If you hit the context button, the rate per 1000 us given and the vaccinated are testing more positive than unvaxed. That is a rate, so totals do not matter.
Positive case rate per 1000, not hospitalization or ICU rate per 1000. Entirely different metric. The hospitalization and ICU numbers you linked clearly show unvaxxed go to ICU at a much higher rate.
Also notice that about ~70% of the population is vaccinated. One could make the case that the “vaccine” has practically zero impact
However, the “vaccine” is known to kill, cause irreversible heart damage, dramatically increase cancer risks, miscarriage and possible fertility issues. There are zero long term studies on long term effects
Um, I don't think so......I was just told that if I had the coof, I am considered as vaccinated for three months. Or, I get to do what they do. Not sure on the way to put it. I'll take it, cuz I'm NEVER getting vaxxed.
Here are some things to think about when reading this data.
1- How are these covid-positive cases identified and included in the set? Are they confirmed by:
A) in-hospital testing?
B) an outside physician/clinic/hospital test?
C) a self-administered test?
D) self-admission/diagnosis without in-hospital lab confirmation?
2- What type of test is being used to confirm these cases (PCR, antibodies, quick and dirty swabbing)?
3- Are the hospitalizations (ICU or not), directly related to covid or something else?
4- In Ontario, the unvaccinated are submitting (voluntarily or not) to many more tests than the unvaccinated specifically because those employers who permit unvaccinated to work, are often required to submit 3+ tests/week.
5- Public Health Ontario has repeatedly used (and admitted within their methodology sections of their published reports) extrapolated numbers often informed by historical data, international published data as well as their own assumptions which place their published numbers at 300% higher than reality. (This point is easily verified by pulling any of the PHO reports using iPHIS, CORES, the COD and the CCMTOOl databases)
When reading these numbers, it is rare to find the numerators and denominators or the methods used to create each group. It takes effort to track down the reports and deal with the medical/epidemiological terminology, statistical jargon and conclusions formed from the details results. This leaves most at the mercy of MSM or their physicians who might be as ignorant of the answers to the questions I posted above, all of which are necessary to properly understand the current situation in Ontario (in this instance).
Taking the data at face value, even though we see the highest rates among the fully vaccinated, this makes sense if the vaccination rates of 80%+ are accurate. The answer to question three then becomes of the utmost importance: are these covid-positive patients in-hospital, or worse, suffering in the ICU because of complications attributed to covid?
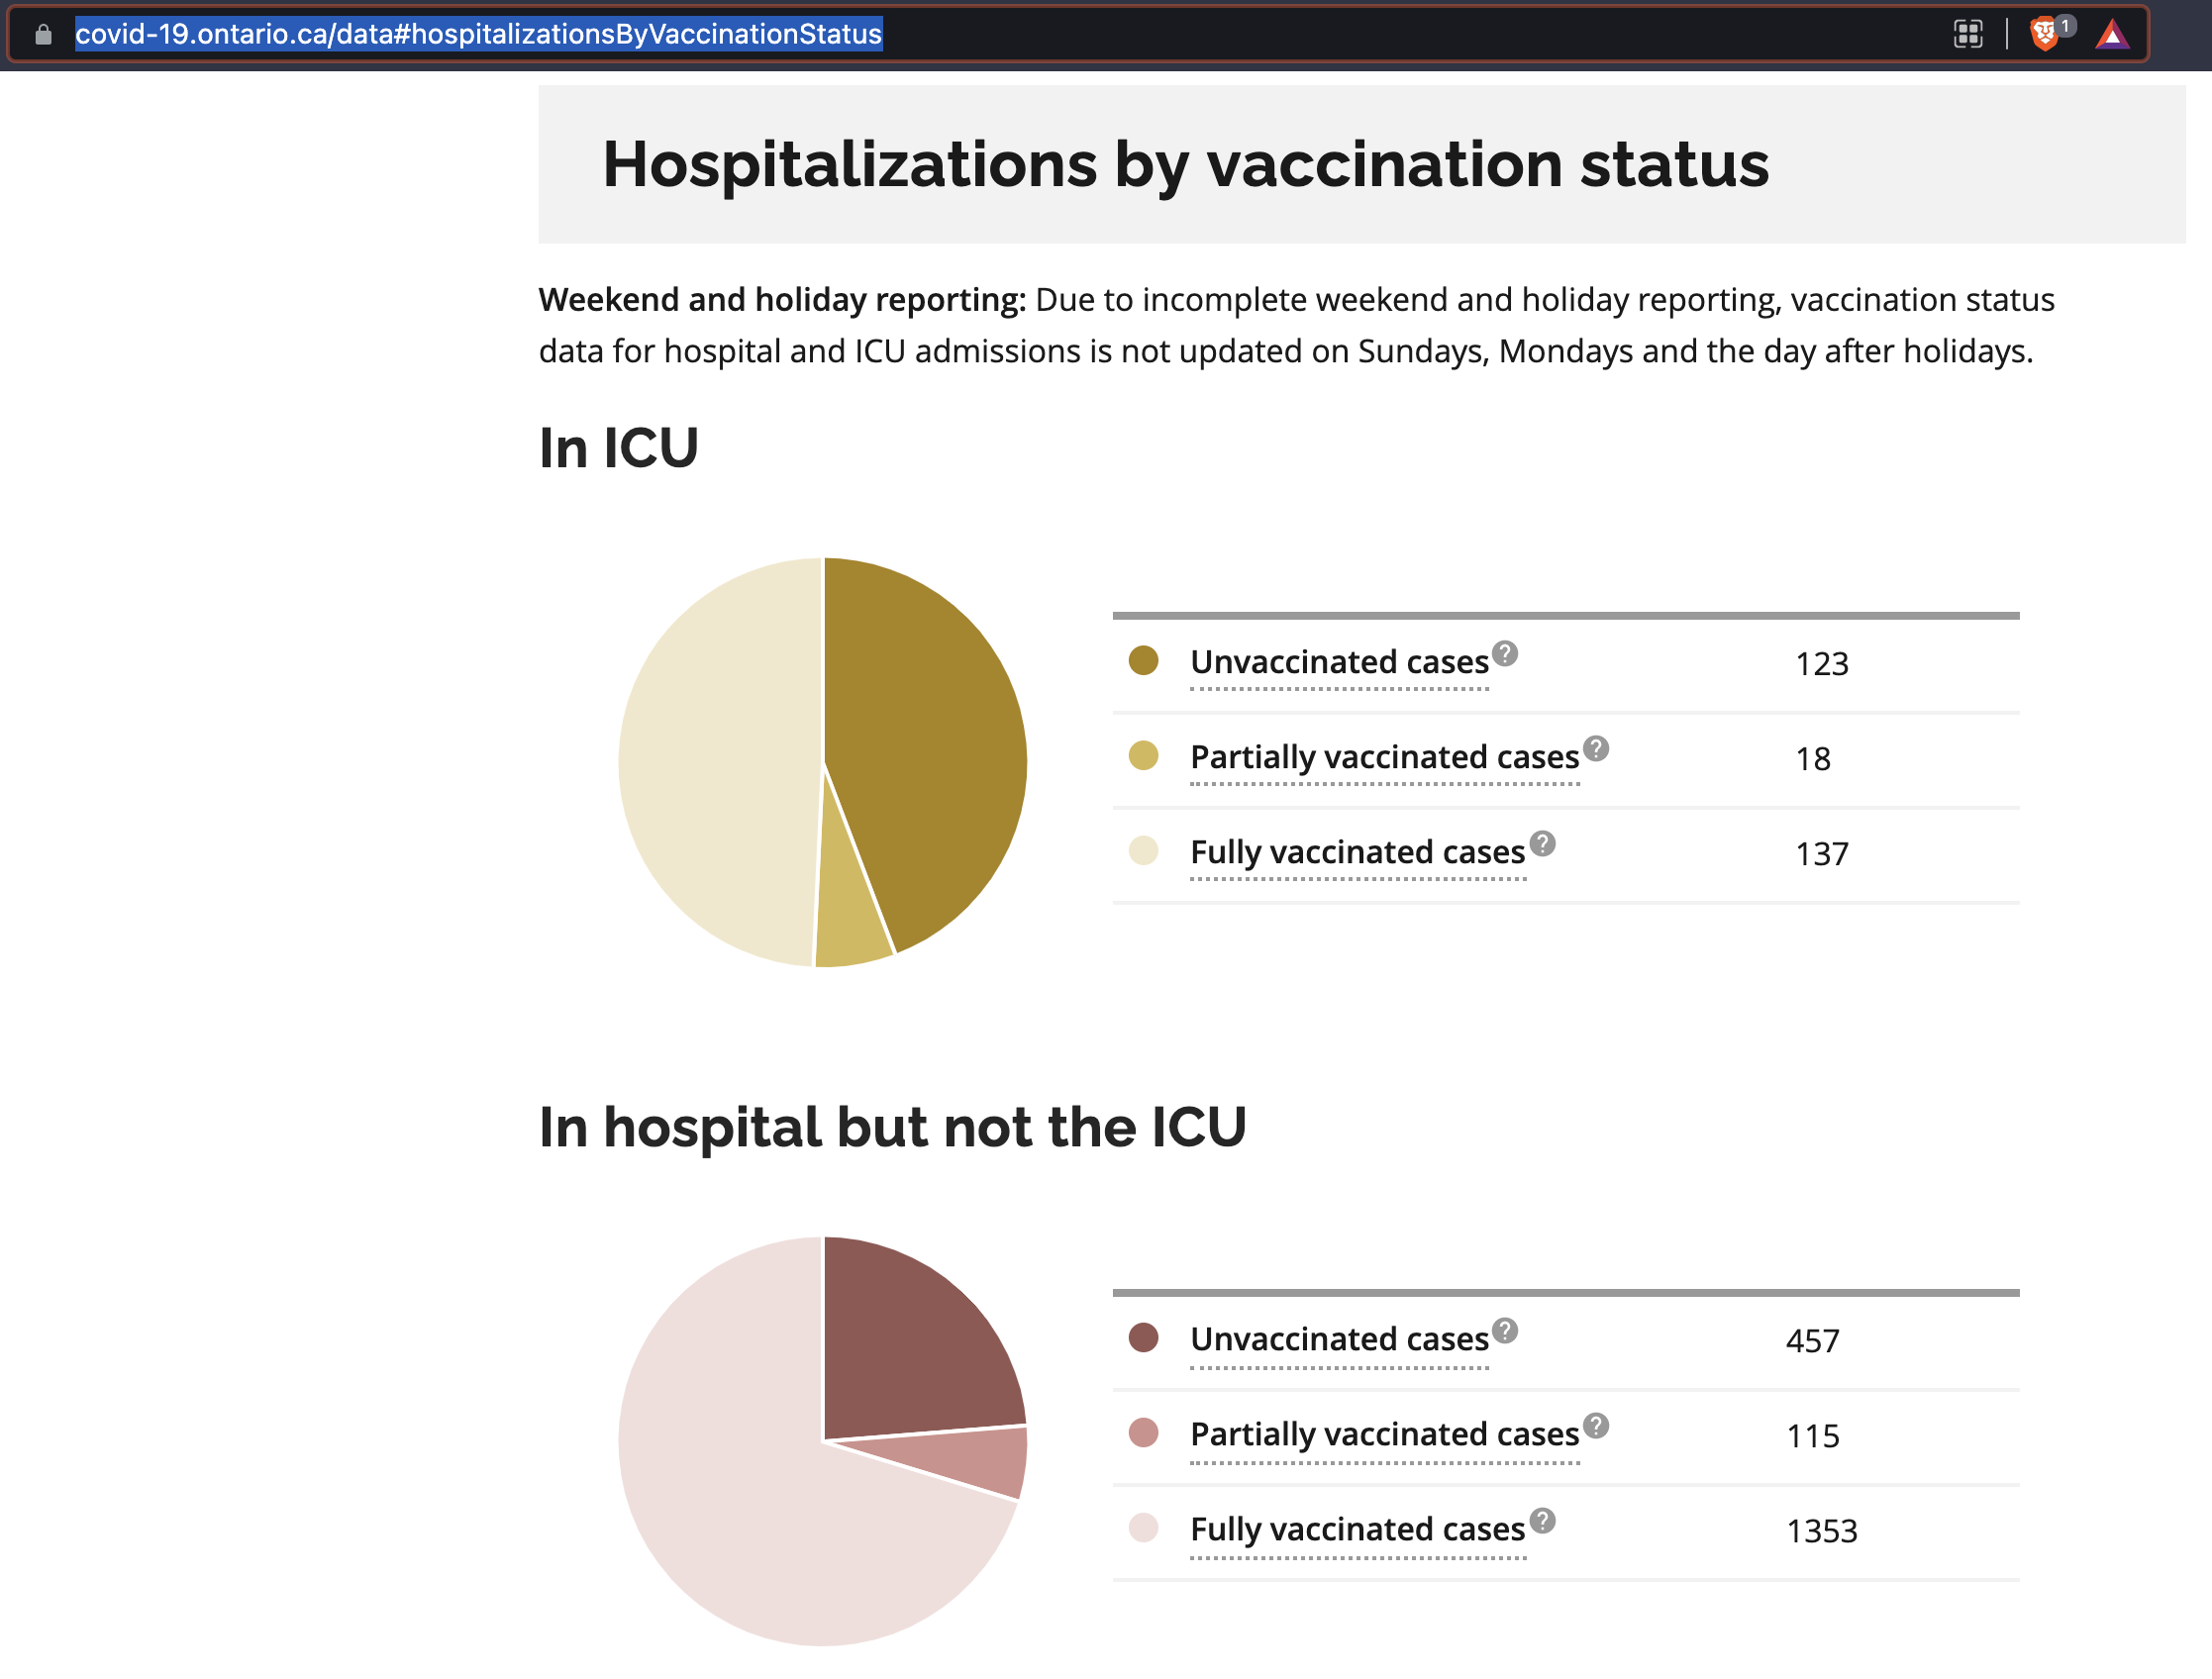
If the answer is NO! That is, they are in-hospital or in ICU because of something other than covid/covid-related illnesses, then of course we should see more patients who are fully vaccinated because they make up 80%+ of the population. From the numbers of in-hospital only, the fully vaccinated make up 70% and change (1353/1925). Not bad given the fully vaccinated are 80%+ of the population. The unvaccinated make up 24% of the cases (457/1925) so a bit more than their presumed 15-20% proportion of the total population. Overall, not a big surprise with those numbers given a NO answer to question 3. Essentially: nothing to see here.
BUT!!!!
If the answer is YES! That is, they are in-hospital/ICU because of covid/covid-related illnesses, the proportionality of the unvaccinated population vs the fully vaccinated takes on extra weight, particularly among the ICU patients. Here, the unvaccinated make up 44% of the total (123/278) whereas the fully vaccinated make up 49% (137/278). This means that (in the context of the published numbers) an unvaccinated person is roughly 4x as likely to end up in ICU than a fully vaccinated person if they are infected with covid.
That's a narrative pro-vaccine folks, like the government would like to push hard.
The problem is, we can't draw that conclusion if we don't know the answer to question 3 above. Moreover, the nitty gritties that make up the numerators and denominators are of such high importance but are hidden from us.
Questions to ask regarding the ICU numbers:
1-What is the average age? Sex? BMI?
2-What is the median age? BMI?
3-What is the geolocation of the patients? Are they randomly distributed across the province or are these numbers corresponding to an outbreak within a city, neighbourhood, at a nursing home? A school? A returning cruise? or flight?
4-What variants are detected and in what proportions?
I can go on and I haven't even touched on the automated methods used for collecting the data, how they are parsed, what software is used and what thresholds are implemented when creating their reports. All of which with I am intimately familiar.
I'm mostly preaching to the choir here I realize, but I think it is still worthwhile drawing one's attention to necessary answers from fundamental questions that are rarely asked and almost never, if ever, answered.
Keep in mind that an intelligent opponent will try to make the case that there are more vaccinated than unvaccinated in Canada. So equal ICU numbers means a greater percentage of unvax in ICU.
Not making that argument myself, just steel-manning their side so nobody gets cause with their pants down.
My hospital insists that 90% of the ICU and ventilated patients are unvaccinated. I wonder how they manipulated it? Our state is vacination rate is supposed to be in the mid 40% area. So if that is exaggerated more than 60% are unvaccinated. ICU and vent a few extra maybe you get close. Something isn't right.
Medfag here. Unfortunately this data is incomplete. Without knowing the percentage of people in the population that are vaccinated, we cannot really determine if the vaccine is effective based on this data.
What this data does show is that, among those who are hospitalized with Covid, if you have been fully vaccinated you are 63% less likely to end up in the ICU than if you are unvaccinated.
That’s just the facts of this data. Some have pointed out that the data is lagging behind the reality right now, that vaccinated cases are on the rise. That may be true. There may be other variables at play too. That’s why generally it’s a bad idea to draw conclusions based on an abstract piece of data.
This data could be cherry picked or any number of things. However, what you shouldnt do is claim that this data shows that vaccines are not effective. Because it doesn’t. Plain and simple.
TLDR: this is ambiguous data and should not be used to draw any conclusions at all, especially not that the vaccines are not effective. I’m against these vaccines fwiw.
I stand slightly corrected. I didn’t look at the rest of the data. if you go to the webpage and look at the rate, you can see that the vaccinated are more likely to have Covid right now than the unvaccinated.
This graph showing rate would be far more effective in showing that vaccines don’t work then the pie chart OP posted. That pie chart is no good as I already stated.
However, again, there are many possible confounding variables. So it’s not great to draw a lot of conclusions from this stuff in a vaccume.
What we can say, however, is that these vaccines are pretty shit. Maybe they help a bit. Maybe they don’t. Can’t say. But they don’t really do their job. And they come with unknown possibly deadly risks.
There is also some selection bias going on here. 100% of people 80 year old or older in this population are vaccinated according to this web page. Younger, presumably healthier people are more likely to be unvaccinated. So this will obviously skew the data.
That’s the problem with thing like this, they often don’t tell the whole story. And there are plenty of ways to manipulate data, as we well know.
They're supposed to be revamping their reporting methods after being criticized for not differentiating between hospitalized/ICU "with" covid vs "due to" covid. Estimates are in the 50% variation range.
This image right here is one the main issues with this "pandemic".
Notice there are only 3 points of data in each pie chart; "Unvaxxed/Vaxxed/1 dose". This doesn't break down any variables such as:
Terminal patients
Nursing home residents
Severely chronically ill
Repeat ICU
Repeat Hosp
ICU/Hosp with "covid" or due covid (Broken arm tests positive. Is hospitalized for broken arm but is now considered covid case)
I checked the site in the URL and it claims anyone with a shot < 14 days = "unvaccinated". So they could get a jab, get sick and die on the 13th day and they'd end up "unvaccinated".
Also, they'll just point that that if you break the population of unjabbed/jabbed down, these charts actually show that unvaccinated are a threat.
They use per 1 million to give the probability of severe disease if you jabbed or not jabbed.
Summary: This type of data is for retarded normies.
Is this just hospitalizations in general or hospitalizations due to covid? I'm really going to be interested to see numbers and breakdown when it comes to people coming in for heart problems etc.. (Though I suspect they will never record that info)

In Alberta "unvaccinated" is defined as "anyone 14 days or under their second shot." And the hospitals are still filled with "fully vaxed."
In addition, there is a category now shown in these pie chart. People whose vaccination status is unknown. If you wanted to manipulate the date, you could chose to shift some cases into that category.
According to their numbers, there should be 423 people in ICU who have tested positive for COVID (per https://covid-19.ontario.ca/data/hospitalizations). The above ICU chart only adds up to 278. It looks like they have 145 patients for which they do not list a vaccination status. In addition, they used to have a disclaimer for the above numbers about them only showing the patients whose vaccination status is known. They have since removed that disclaimer for some reason.
Here is the website where the above came from from reference:
https://covid-19.ontario.ca/data
If you scroll down to just the regular "COVID-19 cases by vaccination status" you will notice 2 things:
If you click on the "Table" view for the graph below "COVID-19 cases by vaccination status" (the default view is "Graph") they list out "Vaccination status unknown Cases". So they do show these for the non hospitalized cases but don't bother to show them for the hospital cases.
If you look at the number of cases per 100,000k people (this is a population adjusted number), more vaccinated people are testing positive on a per 100,000k basis than unvaccinated or even partially vaccinated. Note that the same government that releases these numbers claims the vaccine is the solution to this virus even as their own numbers contradict them.
I will finish off by saying that I have been following this data for the last few months and at times it does behave in a weird way. For example, in late November, the share of fully vaccinated patients in both graphs seemed to be unnaturally adjusted over a period of 3 days. I base this on:
On the last day of this period, the reduction in fully vaccinated patients was exceptionally high in the "In Hospital but not the ICU" graph. Almost twice as high as the number of patients typically added or removed. And it was not coming off a weekend where some hospitals don't report new numbers and then report them all at once (it was November 24th to 25th).
It reversed the trend that was true for at least the last 2 months, where the fully vaccinated group kept gaining share of all the patients. Not every day due to natural variability, but in the long term. There was never a 3 day period where this trend was broken and so significantly.
After this perceived adjustment, the trend resumed (the share of fully vaccinated patients continued to increase again when compared to all the other groups).
Over that period, both the hospital and ICU graphs trended in the same direction at all times. You would expect this if the numbers were both being manipulated together. In itself, this is not proof of anything as both these categories are related so do typically change in the same direction on any given day. However, days where they change in opposite directions are not uncommon and for both of them go opposite to a well established trend for 3 days straight is suspicious.
What I’ve seen is they try to claim the control breaks down like
They gaslight them in an attempt to try and skew / lessen the reality of the numbers by implying there are far more serious illnesses in the unvaccinated - which every single report contradicts. It really is %90 gaslighting and lies they know will be bolstered by the %10 of Confirmation Bias in the normies
Meanwhile they are slowly sorting out that while they feel sicker and sicker and more tired - their friends that are unvaxxed don’t feel shit for the most part.
YESSS THIS
According to this data, a larger proportion of the vaxx-free population is hospitalized than the vaxxed.
The problem is that incidental cases - cases where someone was hospitalized for a non-C19 reason - are included in the stats.
As I understand it, if a vaxxed person goes into the hospital for something like appendicitis, they will not be screened for C19 as part of the process because they are vaxxed. However, if a vaxx-free person is admitted for appendicitis, they are screened for C19, and if they test positive, then they are considered a vaxx-free C19 hospitalization even if they have no symptoms.
Wow! Thanks for the explanation!
Did you read How to Lie With Statistics? LOL
Thx for posting this info, I wasnt gonna bother to look at the actual website because of all the uncertainties that are usually in the released data. To me, the screenshot suggests that the vax does indeed reduce hospitalization.
The vax rate is 77-80% in Ontario, they only make up 55% of icu beds.
They do, however account for ~76% of non-ICU hospital admissions.
Based on this data alone, one could come to the conclusion that the vax does prevent severe disease.
BUT WE MUST ASK OURSELVES, HOW MUCH DO YOU REALLY TRUST ANY DATA COMING FROM THESE PEOPLE...
Not a shill, just a guy who looks at information objectively.
In Alberta, Canada, the vaccinated are starting to take the lead… https://greatawakening.win/p/141EiSzCRd/in-alberta-vaccinated-are-starti/c/
It also seems deceptive that they have the largest portion of the circle a lighter colour than the smaller portions, I think it should be the other way around.
But what is the vaccination rate in Ontario?
If it’s 50%, then the vaxxed may be more prone to serious infection.
If it’s 90%, the unvaxxed are disproportionately effected.
I hate the vax. But math is important.
Hmm not sure I agree with that assessment. If 80% of the population gets vax, and the same percentage of vaxxed/unvaxxed get sick, then it will look like 4x more risk for vax population. Based on this graphic, something like 3x more hospitalizations were vaxxed and maybe 1.2x ICU were vaxxed...but Canada has four times as many vaxxed people as unvaxxed. Bottom line then is that unvaxxed are more likely to be hospitalized and much more likely to go to ICU.
Assuming these numbers are accurate, of course.
If you click the context button and scroll down to the "COVID-19 cases by vaccination status" section, you will see that on about 12/23 the vaccinated surpassed the unvaccinated as a rate per 1000.
I have to ask, how do you add that context button ?
After you create a new post, there is a "set context" link underneath it. Its near the "save" and "delete" links.
Ohhh. Ok. Thanks! I had no idea that existed!
That shows case rate, not hospitalization or ICU rate. That is not relevant unless we can also see how many of each group never got tested. Most stats I have seen show that vaxxed get tested at a much higher rate (probably because they fear the virus more).
youre right and it's too bad people are accusing you of mental gymnastics. i had to take a lot of statistics courses for my work and your math is accurate.
I don't necessarily believe the data that's being released and I think hospitals are killing patients BUT, your interpretation of this graph being presented IS accurate!
The ICU counts are almost even between vaxxed and and unvaxxed when there are 4x more vaxxed. Not sure I follow your logic but that clearly shows unvaxxed go to ICU at a much higher rate.
You are correct. It is a statistical error to compare rates for the vaccinated and unvaccinated based on the general population total. If we lived in a perfect world, I’d want to see propensity score matching for patients and vaccination totals that weren’t “potentially incredibly overestimated” like Bloomberg admitted last month.
The biggest issue is that we cannot trust any of the data being presented. The definition of vaccinated is constantly changing, people are being included in counts when they aren’t even admitted for COVID, and there’s financial incentive to record “COVID cases” and “COVID deaths” that throw all data collection and analysis into question.
Until such time we can establish data integrity, comparing these rates is basically worthless.
Four times more vaccinated people. Same number in ICU. Ergo, unvaccinated are four times likely to be in ICU. Tell me where my logic is wrong.
Dude that's some intense mental gymnastics.
Basically saying that vaxxed pretty much should be none in the ratio if it actually worked. Like if we're talking measles vax or a vax that actually works, if you have a 4:1 ratio of vaxxed to not vaxxed you wouldn't see a similar ratio of the vaxxed to unvaxed catching measles, it would be more like 1 vaxxed catching measles to 4 million unvaxed catching measles If 75% are covid vaxxed and in the hospital/Icu, to 25% not, and a similar ratio are hospitalized/ in icu it means it really doesn't friggin work at all and there's another agenda behind the vaxxxxxx
This is the correct statement. But. They aren't telling you what they're in icu for. Just that they're in icu
These numbers are people hospitalized or in ICU for covid related reasons.
You really lost me on that one. Makes no sense at all.
What doesn't make sense? In a population of 100, say 80 are vaxxed. Say also that 40 vaxxed go to ICU and 10 unvaxxed go to ICU...50% of each. You can't say vaxxed are 4x more likely because the relative rate is the same (and in this data unvaxxed are clearly not going to ICU at the same rate).
This is literally what cognitive dissonance is.
no sorry but it's how rates work. you can't compare raw # of people in the ICU. you have to compare % of vaccinated population that's in ICU to % of unvaccinated population that's in ICU. I do this stuff as my career (not medical, but similar statistical analysis) and comlib is correct.
Yes you can. That's quite literally what sample sizes are. Although those are subject to having their own limitations as well (sampling bias for example). And one would have to then look for statistical significance or effect size to measure reliability and validity.
But to claim the findings mean "nothing at all", well that's just your opinion.
Maybe unvaxed more likely to be sent to ICU because not getting any treatments like Ivermectin. Thats only for the vaxed! So many variables, they are spinning the numbers so many ways.
But remember, unvaccinated means 3 or less shots now. You need a second booster to be full retard.
Or it could mean within 14 days of getting the jab. I pulled up https://covid-19.ontario.ca/data/hospitalizations#hospitalizationsByVaccinationStatus and it didn't define how they are defining the vaccination status.
Thank you. Upvote.
I've been tracking this site for a number of weeks (https://covid-19.ontario.ca/data) and every day it keeps skewing further toward vaccinated being the one's hospitalized and in ICUs.
The same site also shows that (adjusted for population size) the vaccinated test positive at higher rates.
I truly didn't want the ADE stuff to come true but this seems like evidence that it is.
If you watch the Dr. Malone interview on Joe Rogan, you kind of get the hint that the vaccine is ill fitting - and may be harming immune system response.
IIRC, the Netherlands also reported that the vaccine is associated with negative efficacy over unvaccinated efficacy.
Yup. I believe Dr. Malone refers to it as "original antigenic sin," which is well described here: https://pubmed.ncbi.nlm.nih.gov/28479213/
Got it, now do the total vaccinated, any number of shots, and percentage who got heart problems, blood clotting, strokes and other adverse events and then let's do a side-by-side with the same events in the unvaxxed. I'll check back
This is the frustrating part. If it was a binary, "do they have the shot, yes, or no", it would be a lot easier to interpret the data. But these are probably gender study doctors, so they don't believe in binary data, it needs to be fluid to express itself.
Let's put it this way: If someone is not vaccinated, it would not shock anyone if they "got it". If someone is vaccinated, it is shocking that they become infected, as the vaccine obviously failed them. That is all we need to know. Failed, failed, failed.
You are naïve if you think those numbers are accurate.
Can you link some numbers you believe are accurate?
If you were on the actual website, you could hover over the little ? marks and get explanations of the terms. "Unvaccinated" could mean they've had one dose but 14 days haven't passed yet.
Which is the exact Sweet Spot during which many of “the unvaxxed” need to get rushed to the ER with life-threatening jab effects, or die.
There’s the old saw about “lies, damned lies, and statistics” for a reason. It’s exactly how liars in authority operate. Does anyone think a medical bureaucracy that has absolutely gone off the rails is anything resembling an honest broker here?
Nope. My eyes are opening up and seeing the whole industry in an ugly light. My health card expired about 20 years ago and I have no plans to renew it.
Mark Twain said it best: There are lies, damn lies, and statistics.
Ontarians aged 12 or older in 2021 fully vaccinated - 88.4 %.
Vaccinated people there are much bigger group so vaccine "works" based on this dataset.
The thing is you get these "good" numbers temporarily and only in covid-19 statistics. Due to higher inflammation (I think this will become main problem) from vaccines your healt will deteriorate faster in the future. Autoimmune diases, cancers etc... And I don´t even mention serious adverse reaction from vaccines at the moment..
You are not understanding the point.
88% are fully vaccinated and yet are nearly 75% of the hospitalizations. That is not a significant difference, and certainly not worth turning your immune system into a pfizer subscription service over.
The propaganda is often stated that the unvaccinated are driving the pandemic. Clearly not true, per the above.
It is also being stated that our hospitals are full of the unvaccinated so when grandpa has a stroke, he cannot get into the hospital. Again, clearly not true.
Keep in mind the 88% figure is likely bullshit. Also many unvaccinated are people too frail to take the vaccine.
The largest group of unvaccinated is 20-39 very unlikely to hog up any resources or be hospitalized
But the hospitalization and ICU rates are rock solid? How do you decide what is bullshit and what is accurate?
Oh, I see now. Canadians still believe pandemic of unvaccinated narative. With almost 90 % of vaccinated people? Pretty crazy. We were around 60 % and a lot of people saw through it and won´t get booster now. Still not so great either.
88% are vaxxed but vaxxed only make up half of ICU. That is definitely a significant difference (4-6x more risk for unvaxxed) that can't be easily explained away.
Were all people hospitalized with C19 hospitalized BECAUSE OF C19? No.
Are vaxxed people screened for C19 before getting hospitalized? No.
Are vaxx-free people screened for C19 before being hospitalized? Yes.
Is a person who is hospitalized for non-C19 reasons and then tests positive for C19 counted as a C19 hospitalization? Yes.
Irrelevant because that should be equal across both populations. Perhaps covid numbers are over started but that should skew both groups the same.
Relevant because its NOT equal across both groups. Which is the entire point.
I have to step in and play my least favorite character, "Devil's Advocate" :) To be a true comparison, pie charts need to show the percent of each group from the general population. Since there are presumably far more "vaccinated" in Canada, than "un-vaccinated", the percentage of "un-vaccinated" people would likely be much higher than the percentage of "vaccinated" people. (but I won't be getting the clot shot even if there are 1000x more people, as a percentage of their total, who are "un-vaccinated" in the hospital than "vaccinated".
If you hit the context button, the rate per 1000 us given and the vaccinated are testing more positive than unvaxed. That is a rate, so totals do not matter.
Positive case rate per 1000, not hospitalization or ICU rate per 1000. Entirely different metric. The hospitalization and ICU numbers you linked clearly show unvaxxed go to ICU at a much higher rate.
The booster is looking better and better every day /s
Also notice that about ~70% of the population is vaccinated. One could make the case that the “vaccine” has practically zero impact
However, the “vaccine” is known to kill, cause irreversible heart damage, dramatically increase cancer risks, miscarriage and possible fertility issues. There are zero long term studies on long term effects
Wow!
Yeah, I don’t even remotely believe the unvaxxed numbers
Um, I don't think so......I was just told that if I had the coof, I am considered as vaccinated for three months. Or, I get to do what they do. Not sure on the way to put it. I'll take it, cuz I'm NEVER getting vaxxed.
Here are some things to think about when reading this data.
1- How are these covid-positive cases identified and included in the set? Are they confirmed by: A) in-hospital testing? B) an outside physician/clinic/hospital test? C) a self-administered test? D) self-admission/diagnosis without in-hospital lab confirmation?
2- What type of test is being used to confirm these cases (PCR, antibodies, quick and dirty swabbing)?
3- Are the hospitalizations (ICU or not), directly related to covid or something else?
4- In Ontario, the unvaccinated are submitting (voluntarily or not) to many more tests than the unvaccinated specifically because those employers who permit unvaccinated to work, are often required to submit 3+ tests/week.
5- Public Health Ontario has repeatedly used (and admitted within their methodology sections of their published reports) extrapolated numbers often informed by historical data, international published data as well as their own assumptions which place their published numbers at 300% higher than reality. (This point is easily verified by pulling any of the PHO reports using iPHIS, CORES, the COD and the CCMTOOl databases)
When reading these numbers, it is rare to find the numerators and denominators or the methods used to create each group. It takes effort to track down the reports and deal with the medical/epidemiological terminology, statistical jargon and conclusions formed from the details results. This leaves most at the mercy of MSM or their physicians who might be as ignorant of the answers to the questions I posted above, all of which are necessary to properly understand the current situation in Ontario (in this instance).
Taking the data at face value, even though we see the highest rates among the fully vaccinated, this makes sense if the vaccination rates of 80%+ are accurate. The answer to question three then becomes of the utmost importance: are these covid-positive patients in-hospital, or worse, suffering in the ICU because of complications attributed to covid?
If the answer is NO! That is, they are in-hospital or in ICU because of something other than covid/covid-related illnesses, then of course we should see more patients who are fully vaccinated because they make up 80%+ of the population. From the numbers of in-hospital only, the fully vaccinated make up 70% and change (1353/1925). Not bad given the fully vaccinated are 80%+ of the population. The unvaccinated make up 24% of the cases (457/1925) so a bit more than their presumed 15-20% proportion of the total population. Overall, not a big surprise with those numbers given a NO answer to question 3. Essentially: nothing to see here.
BUT!!!!
If the answer is YES! That is, they are in-hospital/ICU because of covid/covid-related illnesses, the proportionality of the unvaccinated population vs the fully vaccinated takes on extra weight, particularly among the ICU patients. Here, the unvaccinated make up 44% of the total (123/278) whereas the fully vaccinated make up 49% (137/278). This means that (in the context of the published numbers) an unvaccinated person is roughly 4x as likely to end up in ICU than a fully vaccinated person if they are infected with covid.
That's a narrative pro-vaccine folks, like the government would like to push hard.
The problem is, we can't draw that conclusion if we don't know the answer to question 3 above. Moreover, the nitty gritties that make up the numerators and denominators are of such high importance but are hidden from us.
Questions to ask regarding the ICU numbers:
1-What is the average age? Sex? BMI?
2-What is the median age? BMI?
3-What is the geolocation of the patients? Are they randomly distributed across the province or are these numbers corresponding to an outbreak within a city, neighbourhood, at a nursing home? A school? A returning cruise? or flight?
4-What variants are detected and in what proportions?
I can go on and I haven't even touched on the automated methods used for collecting the data, how they are parsed, what software is used and what thresholds are implemented when creating their reports. All of which with I am intimately familiar.
I'm mostly preaching to the choir here I realize, but I think it is still worthwhile drawing one's attention to necessary answers from fundamental questions that are rarely asked and almost never, if ever, answered.
The TL:DR version = be not afraid.
Mmmkaaay.
Vaxx are winning the competition of most hospitalizations. And it's going to be larger
Keep in mind that an intelligent opponent will try to make the case that there are more vaccinated than unvaccinated in Canada. So equal ICU numbers means a greater percentage of unvax in ICU.
Not making that argument myself, just steel-manning their side so nobody gets cause with their pants down.
My hospital insists that 90% of the ICU and ventilated patients are unvaccinated. I wonder how they manipulated it? Our state is vacination rate is supposed to be in the mid 40% area. So if that is exaggerated more than 60% are unvaccinated. ICU and vent a few extra maybe you get close. Something isn't right.
Unvaccinated cases of what; COVID-19? I don't believe COVID-19 exists. Those unvaccinated people are in the hospital for something else.
Things are about to get very interesting...
https://ibb.co/MMjcSyN
Medfag here. Unfortunately this data is incomplete. Without knowing the percentage of people in the population that are vaccinated, we cannot really determine if the vaccine is effective based on this data.
What this data does show is that, among those who are hospitalized with Covid, if you have been fully vaccinated you are 63% less likely to end up in the ICU than if you are unvaccinated.
That’s just the facts of this data. Some have pointed out that the data is lagging behind the reality right now, that vaccinated cases are on the rise. That may be true. There may be other variables at play too. That’s why generally it’s a bad idea to draw conclusions based on an abstract piece of data.
This data could be cherry picked or any number of things. However, what you shouldnt do is claim that this data shows that vaccines are not effective. Because it doesn’t. Plain and simple.
TLDR: this is ambiguous data and should not be used to draw any conclusions at all, especially not that the vaccines are not effective. I’m against these vaccines fwiw.
I stand slightly corrected. I didn’t look at the rest of the data. if you go to the webpage and look at the rate, you can see that the vaccinated are more likely to have Covid right now than the unvaccinated.
This graph showing rate would be far more effective in showing that vaccines don’t work then the pie chart OP posted. That pie chart is no good as I already stated.
However, again, there are many possible confounding variables. So it’s not great to draw a lot of conclusions from this stuff in a vaccume.
What we can say, however, is that these vaccines are pretty shit. Maybe they help a bit. Maybe they don’t. Can’t say. But they don’t really do their job. And they come with unknown possibly deadly risks.
There is also some selection bias going on here. 100% of people 80 year old or older in this population are vaccinated according to this web page. Younger, presumably healthier people are more likely to be unvaccinated. So this will obviously skew the data.
That’s the problem with thing like this, they often don’t tell the whole story. And there are plenty of ways to manipulate data, as we well know.
So 83% of people in Ontario have received at least one shot, yet the 17% who haven’t represent almost half those in the ICU?
ICU is a lagged indicator
When the cases shit show popped off hospitalizations were 40% vaccinated vs 60% unvaccinated
Now it's 76% vaccinated and 24% unvaccinated
Now that the majority are hospitalized I expect the ICU figures to dramatically change in the unvaccinated favor.
That is a great point.
They're supposed to be revamping their reporting methods after being criticized for not differentiating between hospitalized/ICU "with" covid vs "due to" covid. Estimates are in the 50% variation range.
exactly, isnt math fun
Correct, which means the unvaxxed population is something like 4x more likely to go to ICU.
There are valid concerns about vaccine safety out there but these sorts of posts are just misleading and make skeptics look like fools.
This image right here is one the main issues with this "pandemic".
Terminal patients Nursing home residents Severely chronically ill Repeat ICU Repeat Hosp ICU/Hosp with "covid" or due covid (Broken arm tests positive. Is hospitalized for broken arm but is now considered covid case)
Also, they'll just point that that if you break the population of unjabbed/jabbed down, these charts actually show that unvaccinated are a threat.
They use per 1 million to give the probability of severe disease if you jabbed or not jabbed.
Summary: This type of data is for retarded normies.
Is this just hospitalizations in general or hospitalizations due to covid? I'm really going to be interested to see numbers and breakdown when it comes to people coming in for heart problems etc.. (Though I suspect they will never record that info)
Seems legit, here is the direct link to the data: https://covid-19.ontario.ca/data#hospitalizationsByVaccinationStatus
HMMMMM lol
*not triple jabbed is unvaccinated to them and it only counts after 14 days.
Yeah if they keep raising the bar of course they can manipulate the statistics how they want.
Looks like we need to just get one jab!
it is probably a reflection of the % vaxed of the population for the ICU. But I am guessing the 2nd graph doesn't look good for being jabbed.
As usual with dishonest people, it depends on what your definitions of "vaccinated" and "unvaccinated" are.
This isn't a good argument for non-vaccination. You have to look at the RATE, not the QUANTITY.
The rate is provided in the context link. Scroll down. Vaccinated are now testing more positive than unvaccinated.
I see it. I withdraw my comment and stand corrected.
Your are not wrong. The per 1000 is positive case rate, not hospitalization or ICU rate.